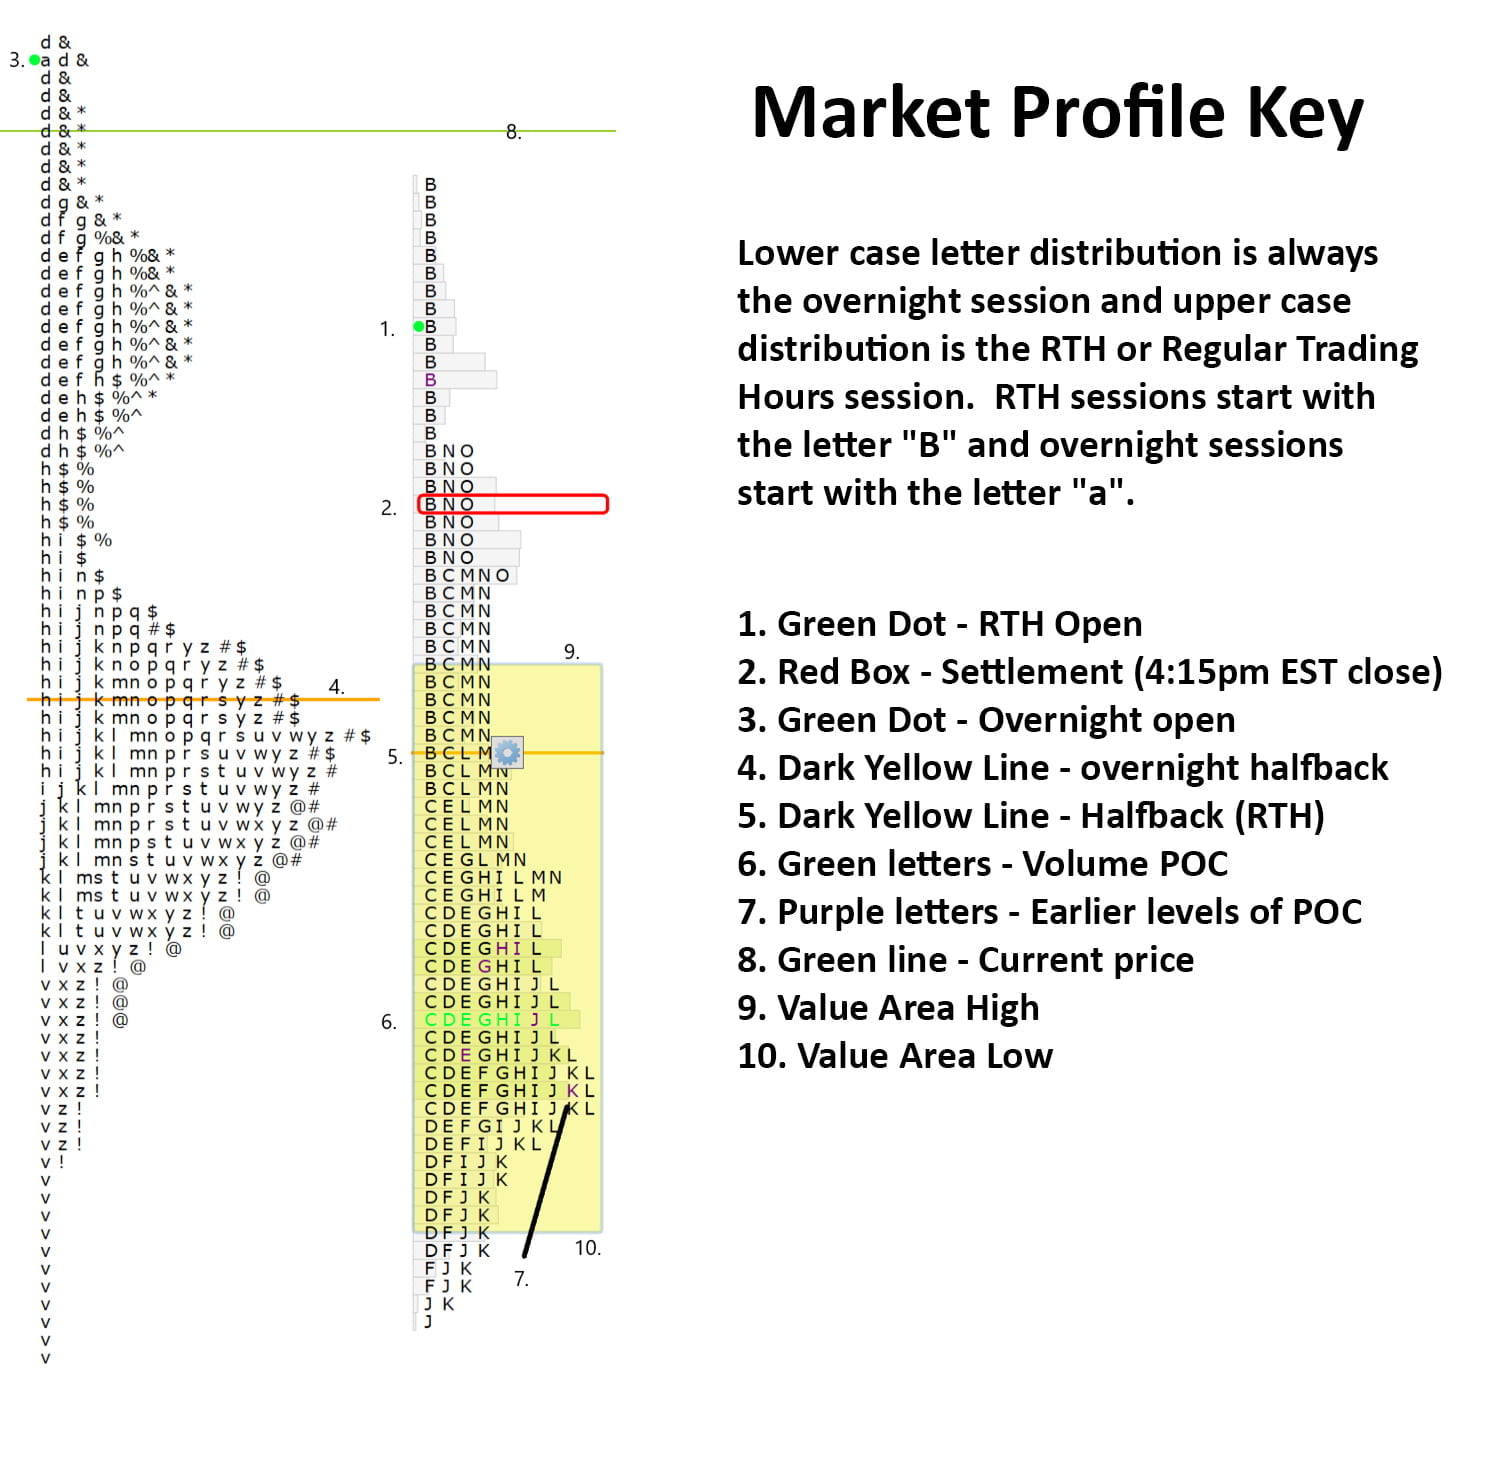
The Market Profile value areas and ShadowTrader Pivots for /ESU22 and /NQU22 Futures are posted free every morning in the ShadowTrader Swing Trader newsletter.

WindoTrader 702-800-4628 Speak with Terry about the ShadowTrader discount or CLICK HERE to learn more.
Click HERE for a market profile key that will help you interpret the chart above.
Pre market indications
| Opening In/Out Balance | out of balance |
|---|---|
| Overnight Inventory | net long |
| Current Price/Overnight Range | middle third |
| Shock and Awe | yes |
| Potential for Early Trade | yes |
| Short Term Bias | uptrend broken, prices below 20sma daily |
Key Levels for Today
| 4187.75 | ONH |
|---|---|
| 4180.50 | Bottom of Gap |
| 4158.50 | RTH High |
Ongoing Narrative / Commentary
Large overnight gap has faded to no gap at all as prices are currently marking inside of yesterday’s RTH range. Opening above that RTH High would be a true gap higher, opening within range (even if above the settlement) would not.
Market slightly on edge ahead of Friday’s Jackson Hole speech by Fed Chair Powell. That is happening at 10am ET tomorrow.
The last three RTH sessions have had unchanged value and I am seeing them as a balance area. We are currently well off of the ONH and that could spell some overhead supply in the early part of today’s session. Remember that there has been no real up trend since the larger move down, but more of a sideways consolidation.
Unless buyers get it in gear soon and with some gusto, I would be leaning towards the downtrend resuming.
Yesterday’s chart of the day was an hourly /ES and I’m going with the same thing today as there is an important trendline from the recent swing low that we are sitting right on currently. Any price action below that line essentially stops the recent uptrend and we would officially be going back down again. Holding above it is more bullish.

VPOC’s
- 08.16 4308.25
- 08.18 4278.00
- 08.19 4230.75
- 08.02 4094.25
- 07.28 4073.50
- 07.27 3975.00
- 07.26 3924.25
- 07.13 3808.00
- 07.14 3794.25
- 06.17 3675.50
Scenarios
- Being so far off of the ONH and coming into range creates overhead supply which has potential to be bearish at the open. Watch the trendline (hourly chart above) closely. Any early weakness should target the settlement.
- Finding acceptance within yesterday’s range would keep the market in balance and increase odds of the downtrend resuming. Holding outside of the recent balance would be the opposite.
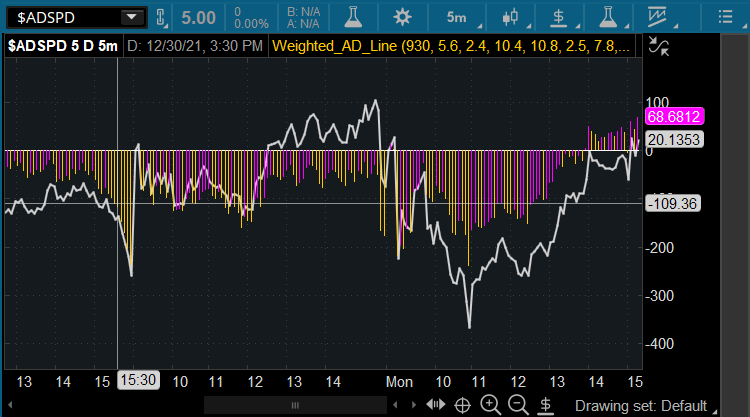
Weighted S&P A/D Line Indicator
This script plots both an unweighted and a weighted A/D line using the 11 S&P sectors and their respective weights. This gives the trader a huge edge in discerning the strength of moves and also knowing when there is positive or negative divergence in heavier versus lighter weighted sectors as the day unfolds.
GET YOURS NOW