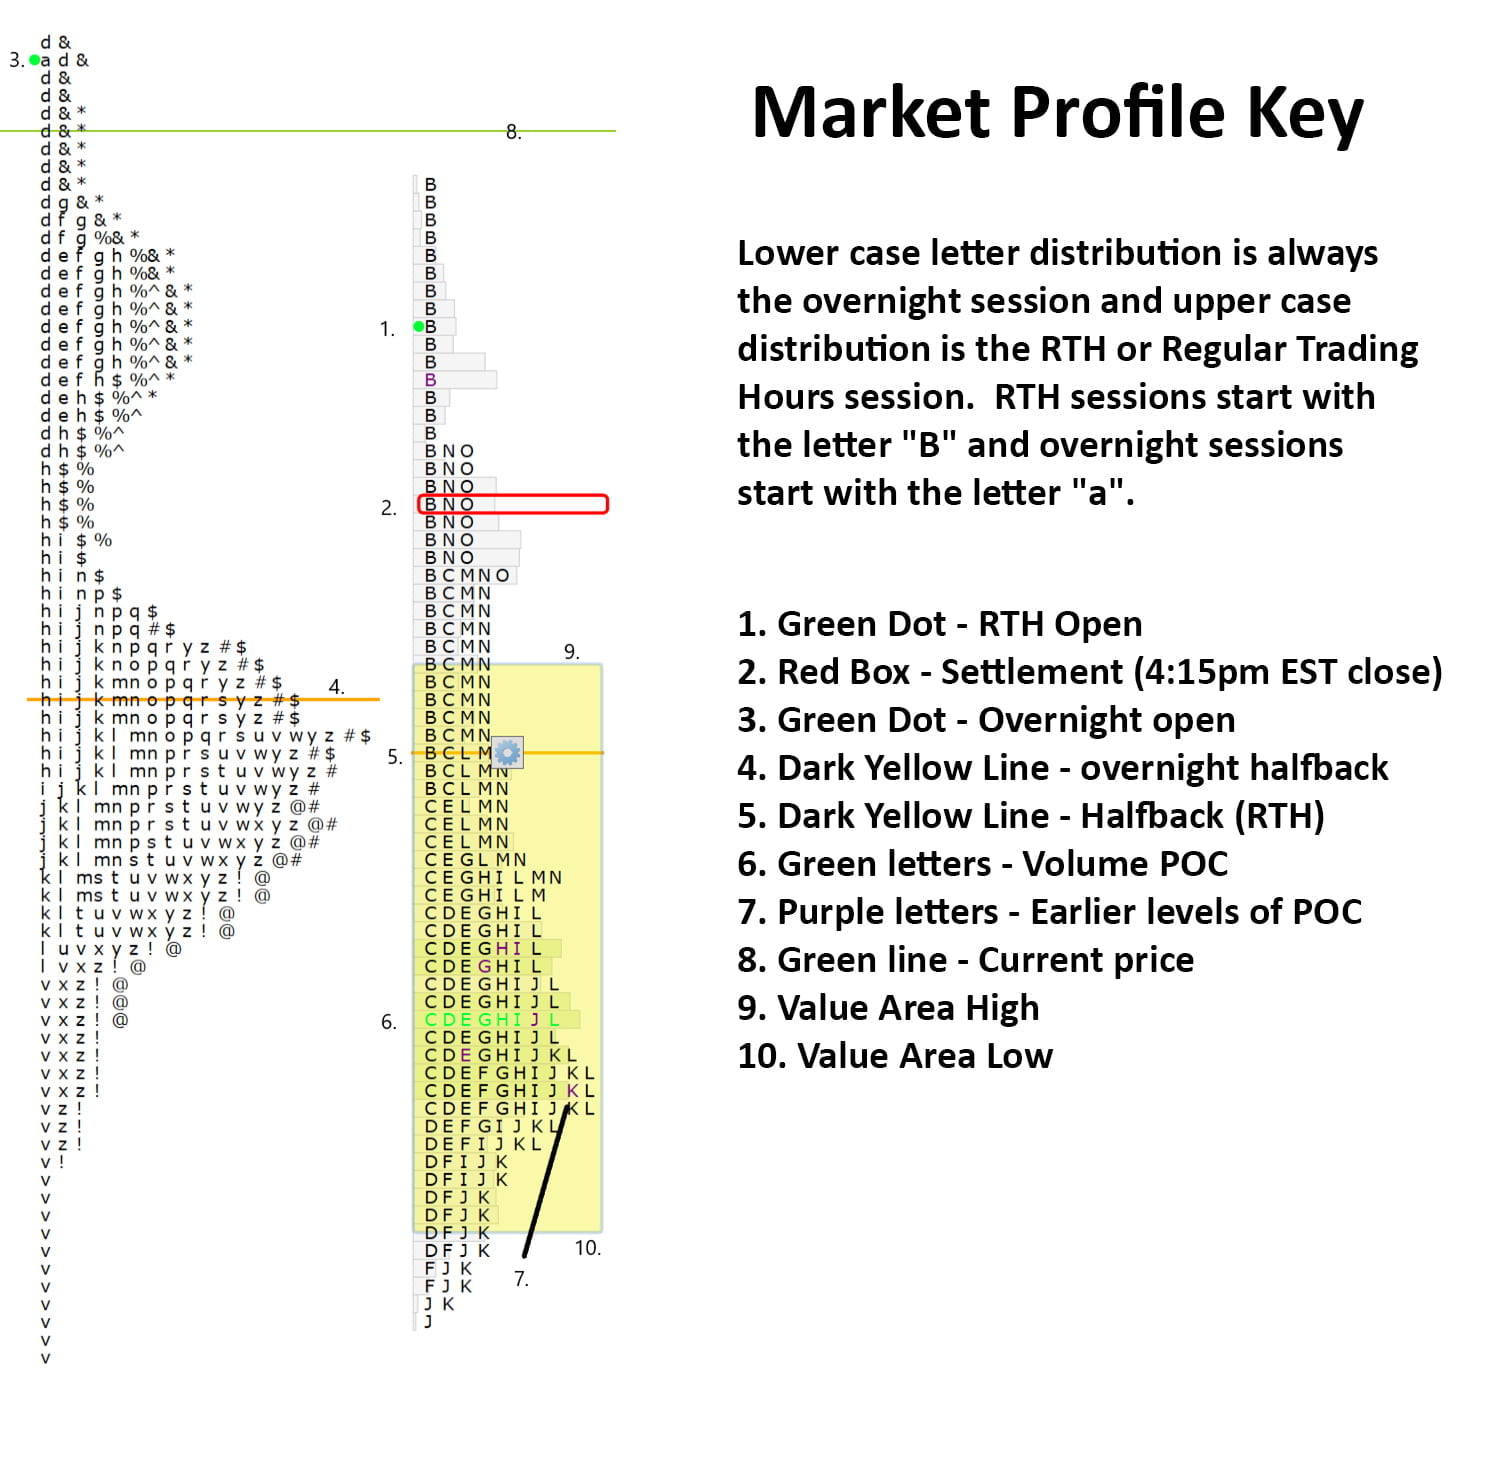
The Market Profile value areas and ShadowTrader Pivots for /ESH22 and /NQH22 Futures are posted free every morning in the ShadowTrader Swing Trader newsletter.

WindoTrader 702-800-4628 Speak with Terry about the ShadowTrader discount or CLICK HERE to learn more.
Click HERE for a market profile key that will help you interpret the chart above.
Pre market indications
| Opening In/Out Balance | in balance |
|---|---|
| Overnight Inventory | balanced |
| Current Price/Overnight Range | middle third |
| Shock and Awe | no |
| Potential for Early Trade | no |
| Short Term Bias | neutral to bearish, below 20 and 50 SMA daily |
Key Levels for Today
| 4688.25 | ONH |
|---|---|
| 4665.00 | RTH High / Top of Spike |
| 4653.25 | ONL |
| 4646.00 | Bottom of Spike |
| 4618.75 | Halfback |
Ongoing Narrative / Commentary
Large short covering reversal yesterday which was a bit of a head scratcher only because it happened just after breaking trends in both the /ES and and the /NQ.
Overnight action continued that theme for at least part of its session but has since come down just to the top of yesterday’s range which ended on a spike. Spike rules are in play for today’s session and will tell us a lot about the natur of the buying late day yesterday.
VPOC’s
- 01.05 4780.00
- 12.03 4508.00
Scenarios
- If there is a small gap by the time we open, focus on the RTH High and whether or not prices move into the spike or not. Remember that opening above the spike and holding is the most bullish outcome with subsequent amounts of penetration/acceptance into the spike incrementally less so.
- Note that the M.G.I. that we have so far has an overnight low which is about in the middle of the spike which shows overnight acceptance of the higher prices. This does not mean automatically that the RTH session will continue but simply that you should pay close attention to the ONL in early trade. If the ONL is taken out, target the Bottom of the Spike and monitor for continuation from there. Any acceptance below halfback puts sellers firmly back into control.
- Prices that can stay out of range would indicate that shorts are not done covering and pullbacks may be buyable if we can hold outside of range.
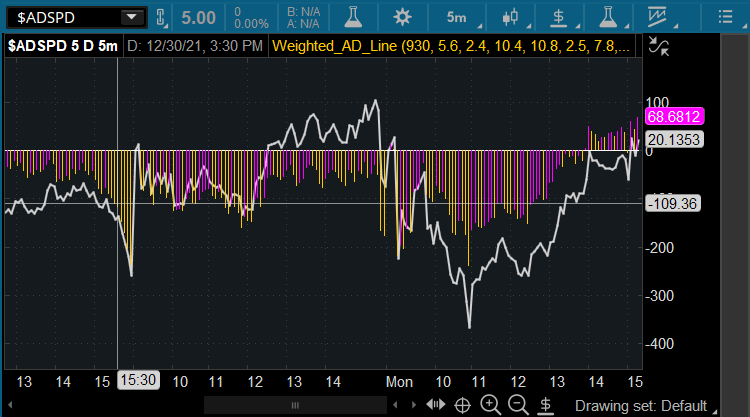
Weighted S&P A/D Line Indicator
This script plots both an unweighted and a weighted A/D line using the 11 S&P sectors and their respective weights. This gives the trader a huge edge in discerning the strength of moves and also knowing when there is positive or negative divergence in heavier versus lighter weighted sectors as the day unfolds.
GET YOURS NOW