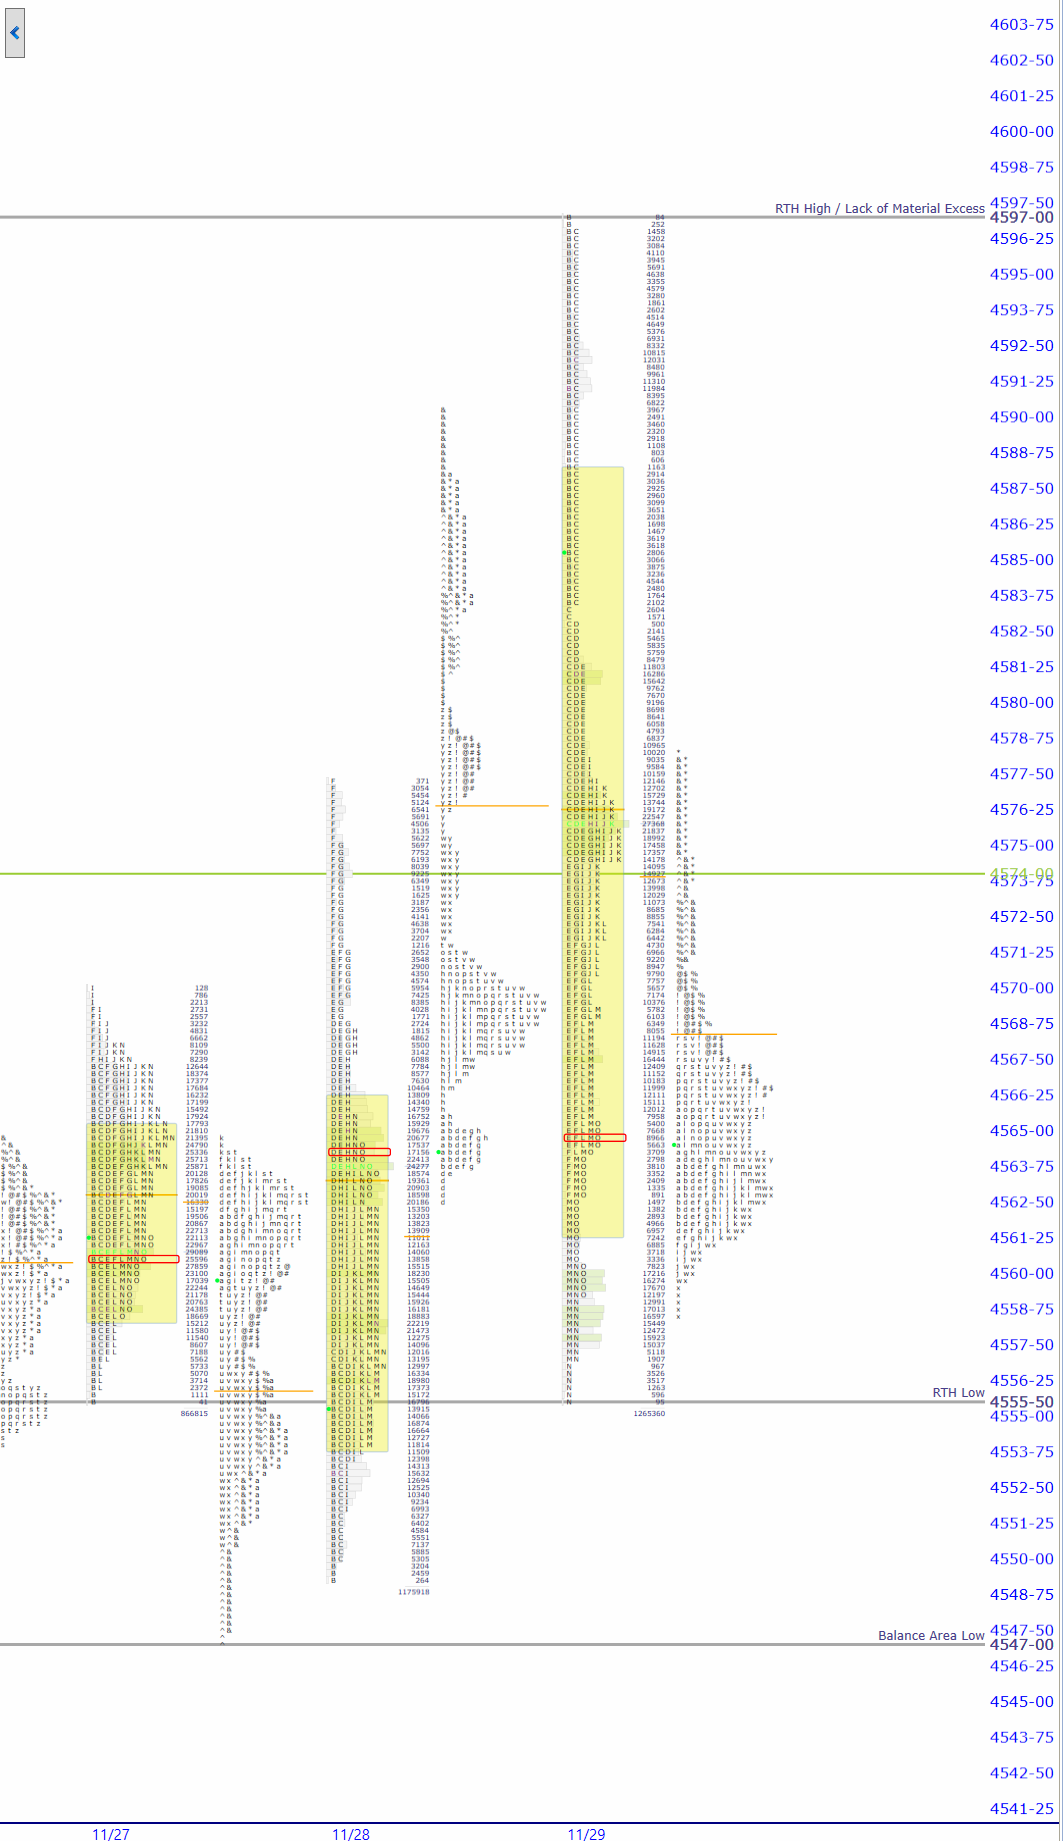
- Look above and fail yesterday bringing /ES back into recent balance area
- Potentialk for rotation back to lower end of balance is increased. Kedy word: potential
- Almost all overnight activity is within the VA with no price exploration outside of range.
- No major shift in value yesterday. Buyers may just be tired. Use caution.
| Pre Market Indications | ||
| Opening In/Out Balance | in balance | |
| Overnight Inventory | balanced | |
| Current Price/Overnight Range | uppper third | |
| Shock and Awe | no | |
| Potential for Early Trade | no | |
| Short Term Bias | bullish | |
Scenarios
- Non true gap within range on balanced o/n inventory means trade later rather than earlier. Let the market tell you what the bias and tone is going to be.
- The RTH High yesterady went right to a prior Swing High and thus can be considered weak on a retest. Monitor for continuation on any buys at this level.
- A loss of the ONL should move market closer to Balance Area Low. On weakness, I would be targeting that area.
| Today’s Market Profile Chart |
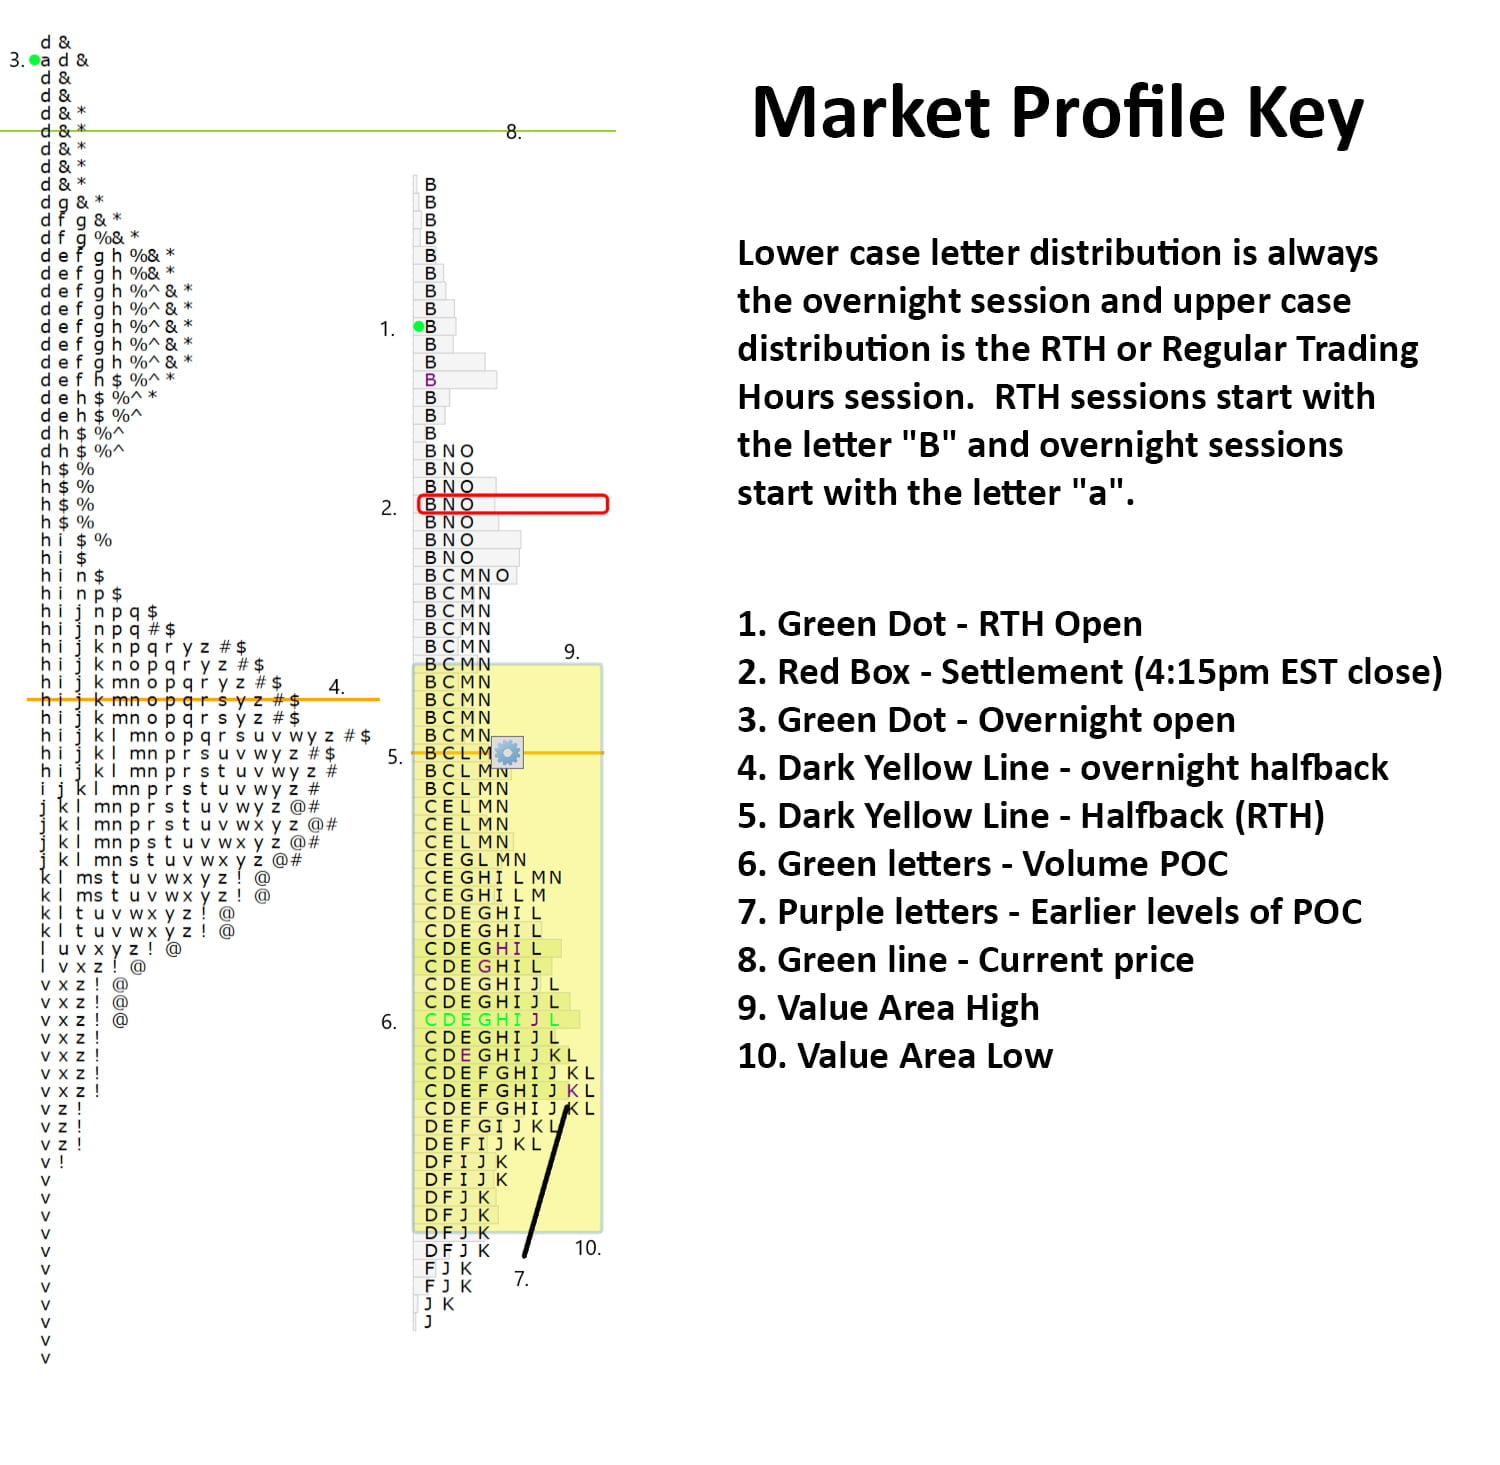
The chart provided is from WindoTrader. CLICK HERE to learn more about the ShadowTrader discount. Interpret the chart above with the Market Profile Key.
| Key Levels for Today | ||
| 4597.50 | RTH High / 9.1 Swing High | |
| 4555.50 | RTH Low | |
| 4547.00 | Balance Area Low | |
| Virgin Point of Control (VPOC) | ||
| 11.21.2023 | 4548.50 | |
| 11.13.2023 | 4425.75 | |
| 11.09.2023 | 4362.00 | |
| 11.02.2023 | 4336.00 | |
| 10.24.2023 | 4270.50 | |
| 11.01.2023 | 4256.50 | |
| 10.31.2023 | 4211.75 | |
| 10.27.2023 | 4132.00 | |
| Today’s ES and NQ Market Profile and Pivot Point Numbers | ||
| Value Area High | 4588.25 | 16126.00 |
| Point of Control | 4575.75 | 16090.00 |
| Value Area Low | 4561.25 | 16026.00 |
| R3 | 4627.00 | 16345.50 |
| R2 | 4612.00 | 16277.00 |
| R1 | 4585.50 | 16150.50 |
| Pivot | 4570.50 | 16082.00 |
| S1 | 4544.00 | 15955.50 |
| S2 | 4529.00 | 15887.00 |
| S3 | 4502.50 | 15760.50 |